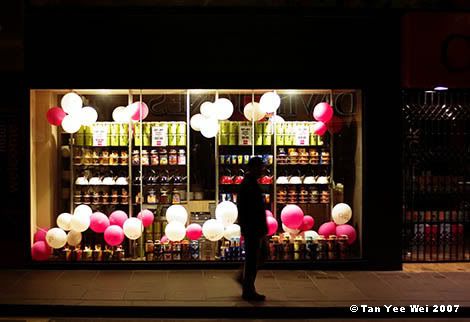
Pink
Click here for large size image
Click here for Deviant Art entry
Meyer-Optik Görlitz Lydith 30mm f/3.5
Labels: photography

Labels: photography
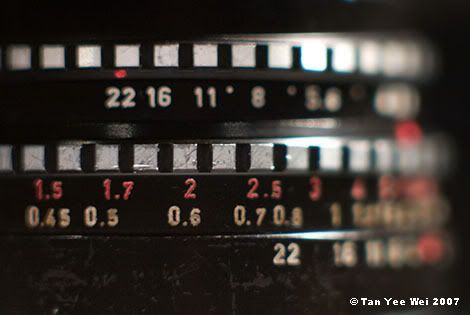
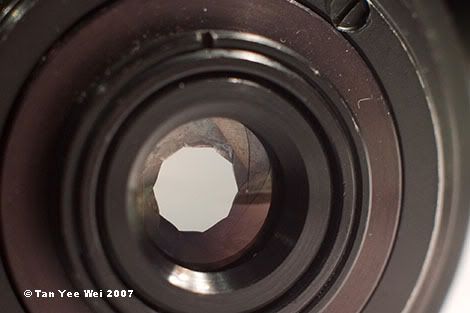
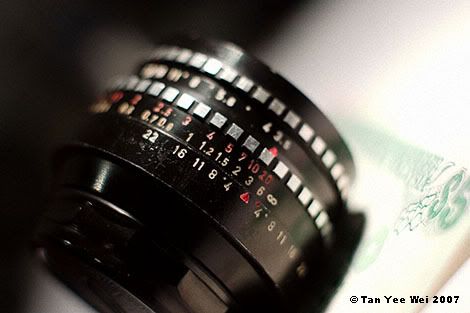
Labels: photographic equipment, photography
Labels: personal
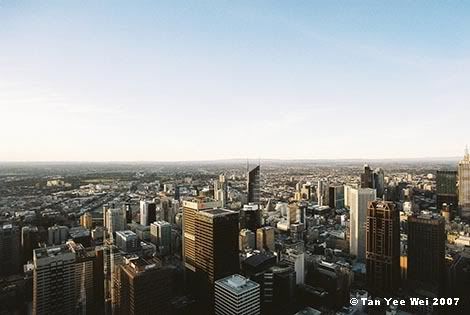
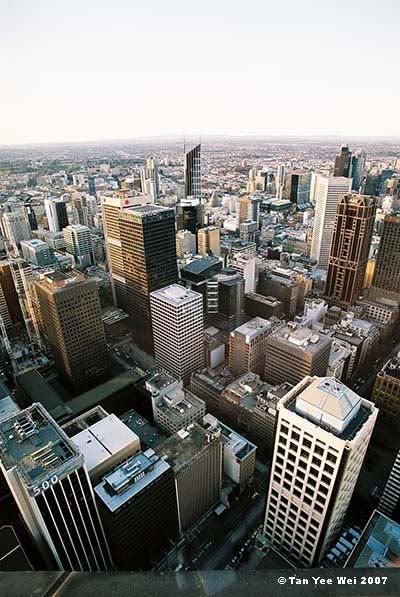
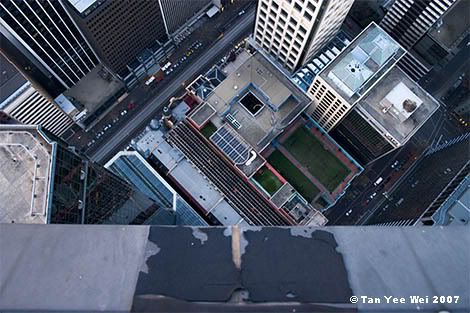
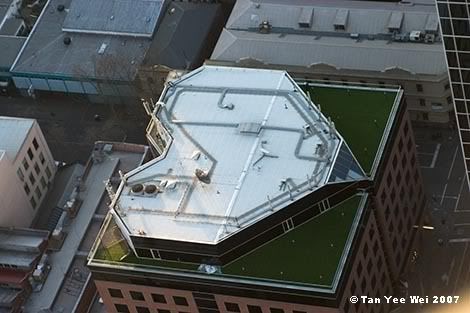
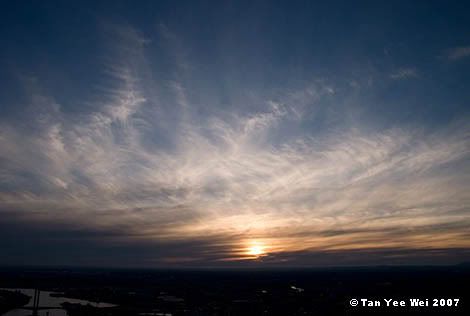
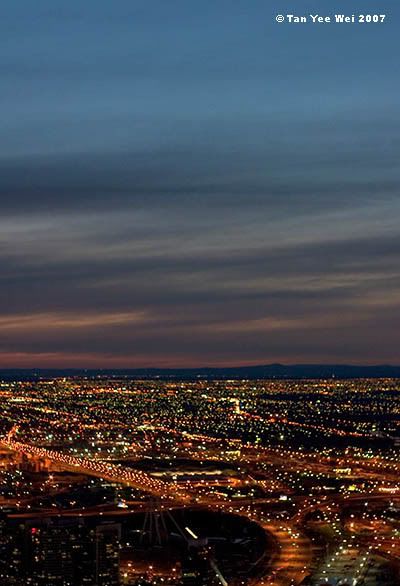

Labels: Melbourne, photography

Labels: photography
Labels: compositions, personal


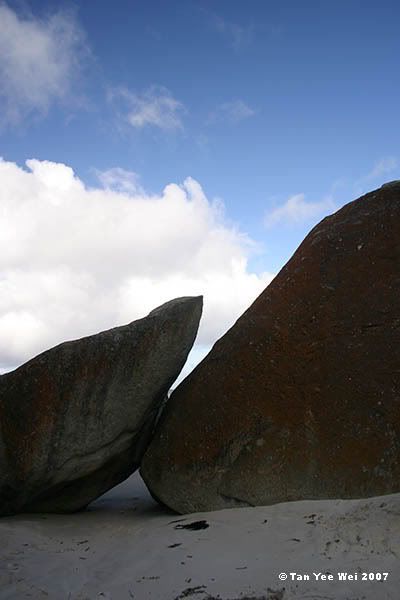

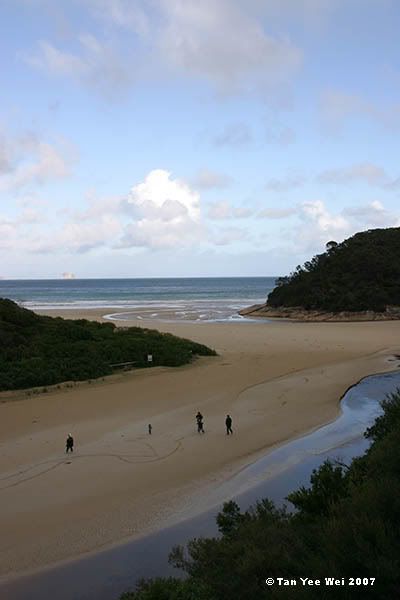


Labels: photography
Labels: applied mathematics, personal

Labels: photography
Labels: photography


Labels: holidays, photography
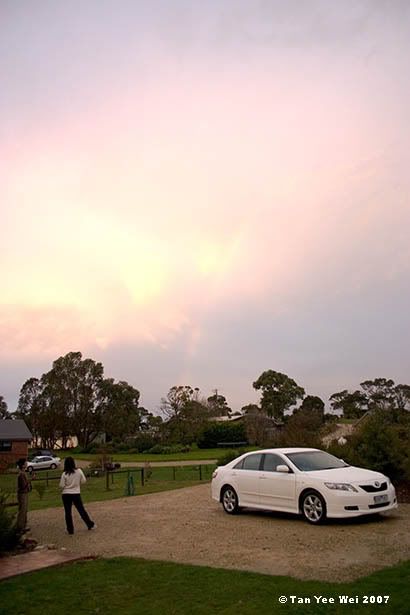
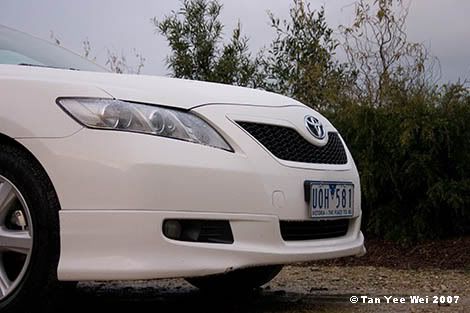
A sign recommended 20 km/h for an upcoming left hander, the low speed suggesting a tight hairpin. From 100 km/h, ease onto the brakes and slip deep into the wrong side of the road, tyre walls brushing the grass verge. Gently get off the brakes and slowly start turning in early, balancing the decrease in brake force with an increase in steering angle. Let the other tyre walls rumble on the crumbled inside edge of the road, timing the events precisely so that this was the instant of maximum steering input and zero braking. The speed is now 40 km/h, 20 over the recommended but still not uncomfortable owing to the huge turning radius. Past the apex, gradually open the throttle while letting the steering wheel slowly unwind itself. Balance the unwinding rate so that the car just touches the far edge of the tarmac when the car straightens out.

Labels: observations, personal
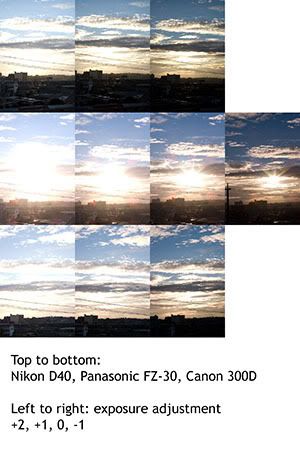
Dynamic range explained
Dynamic range is typically quoted in units ‘stops’. One stop represent 2 times of difference in light intensity; two stops represent 4 times; three stops, 8 times; 4 stops 16 times; 5 stops 32 times…
At first glance, it may appear odd that the dynamic range is quoted in multiplicative form (8 times, or 3 stops) instead of additive (3 lux, 4 lux, 5 lux…). The logic is demonstrated in the following example:
A hypothetical sensor would be black if 5 photons or less hit it, and would be white if 160 or more photons hit it. Once can see that the dynamic range is 160/5 = 32 times, or in a more conventional notation, 5 stops.
Consider two light sources giving out 5 photons per second and 3200 photos per second. Exposing a sensor to each of these sources for a second would expose them to give black and white, as the sensors would receive a total of 5 and 3200 photons respectively in that one second of exposure.
However, let the light sources be brightened significantly, so that the dim light now throws out 5000 photons per second, and the bright light is worth 3,200,000 photons per second. Exposing the same sensors to these light sources for a short period of time, 1/1000 second, would still result in 5 and 3200 photons on each sensor, again giving us black and white.
In both cases, the ratio of light intensities between the bright and dark sources is the same:
3200 photons per second / 5 photon per second = 32
3.2 million photons per second / 5000 photon per second = 32
However, the difference in intensity is not identical:
3200 – 5 = 3195 photons per second
3195000 photons per second
Thus the multiplicative manner of describing dynamic range makes more sense than additive.
Histograms explained
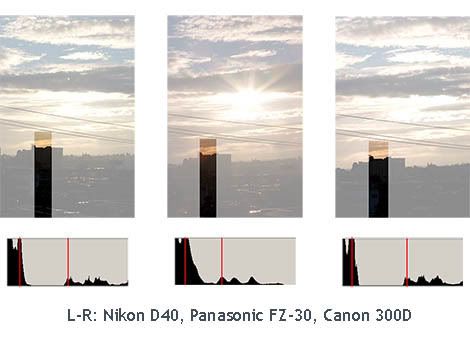
Histograms show the frequency of various darkness levels within the image. The horizontal axis shows the darkness of pixels (dark on the left, bright on the right) and the vertical axis shows the quantity of pixels corresponding to each darkness level.

Labels: applied science, photographic equipment, photography